Early Insulin Resistance: Signs That Matter and Tests That Confirm Risk

Afternoon crashes, stronger cravings, and waist changes that appear before your labs look “abnormal” can feel confusing. This may not be random, and it is not a personal failure. The encouraging news: early insulin resistance often leaves clues before blood sugar reaches the prediabetes range.
Quick Win: For the next 7 days, take a 10–15 minute easy walk after your largest carbohydrate-containing meal and note your energy, cravings, and sleepiness afterward.
Which early insulin resistance signs matter most?
The early insulin resistance signs that matter most are patterns: increasing waist circumference, higher triglycerides, lower HDL cholesterol, rising blood pressure, fatty liver markers, acanthosis nigricans, PCOS-related features, and repeated sleepiness or cravings after carbohydrate-heavy meals.
The tests that best confirm related metabolic risk are fasting plasma glucose, A1C, and a 2-hour oral glucose tolerance test. Fasting insulin and HOMA-IR may add context, but they are not universally standardized stand-alone diagnostic tests.[1]
Key takeaways
- Early insulin resistance can exist while fasting glucose and A1C still look normal.
- Clusters of signs matter more than one isolated symptom.
- Waist, triglycerides, HDL cholesterol, blood pressure, liver markers, and skin changes can reveal metabolic risk.
- OGTT may catch impaired glucose tolerance that fasting glucose misses.
- Fasting insulin and HOMA-IR can be useful context, but interpretation varies by lab and population.
Why can insulin resistance start before glucose looks abnormal?
Insulin helps muscle, liver, and fat tissue respond to incoming fuel after meals. When those tissues become less responsive, the pancreas may release more insulin to keep glucose in range.[2]
That compensation can make early insulin resistance hard to spot. A routine fasting glucose test asks, “Is glucose high right now?” It does not directly ask, “How much insulin was needed to keep it there?”
Over time, compensation may become less effective. Glucose can rise after meals or during an oral glucose tolerance test before fasting glucose becomes clearly abnormal.[3]
This is why a fuller pattern matters. Sleep disruption, low activity, excess visceral fat, genetics, stress load, PCOS, certain medications, and fatty liver risk can all influence insulin sensitivity.
If your A1C looks normal but the pattern still feels suspicious, this guide on insulin resistance with normal A1C explains why average glucose does not always tell the whole story.
Early insulin resistance symptom checklist
This checklist is not a diagnosis. It is a practical way to decide whether a lab discussion with a qualified clinician may be useful.
- Waist circumference has increased over time.
- Triglycerides are rising or HDL cholesterol is low.
- Blood pressure is trending upward.
- Post-meal sleepiness, brain fog, or cravings happen repeatedly.
- Skin changes appear around the neck, underarms, or groin.
- Skin tags appear alongside other metabolic risk markers.
- ALT, AST, or imaging suggests fatty liver risk.
- PCOS, prior gestational diabetes, or strong family history is present.
- A1C or fasting glucose is still “normal” but trending upward.
Which signs deserve attention?
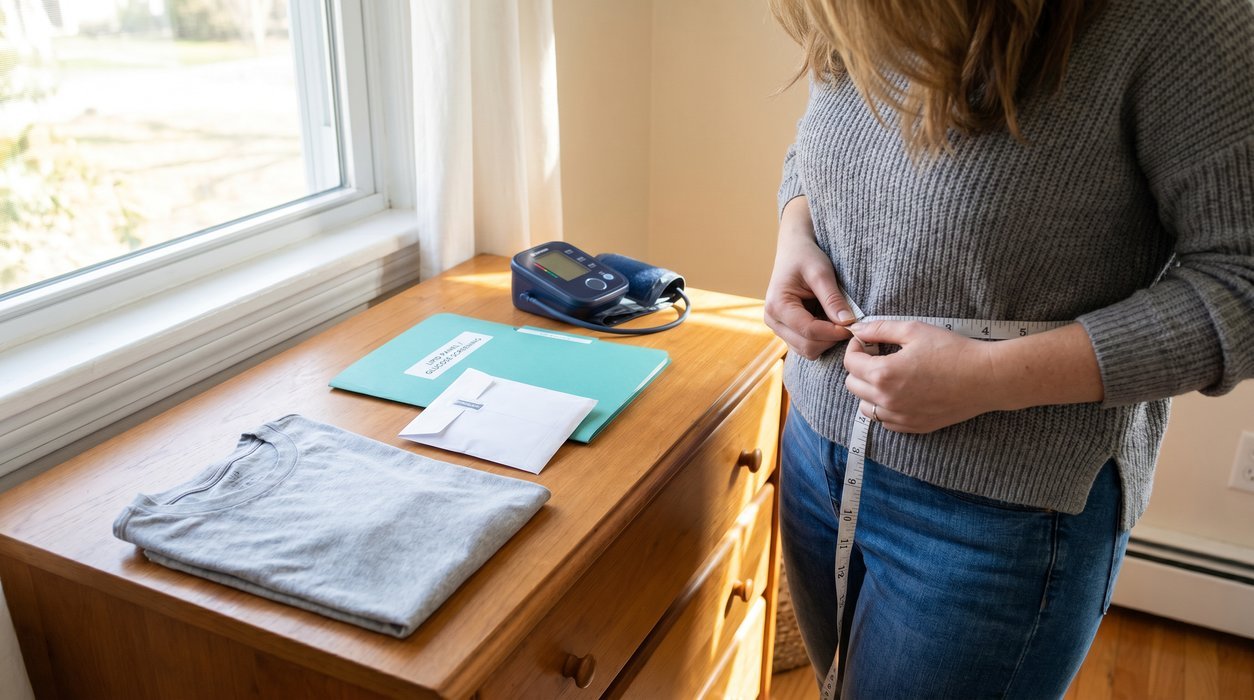
1. Waist gain that feels harder to shift
Increasing waist circumference can reflect more visceral fat around the organs. Visceral fat is strongly associated with insulin resistance, triglyceride changes, fatty liver risk, and cardiometabolic strain.
This is not about appearance or blame. It is about where fat is stored and how that tissue communicates hormonally and metabolically.
2. Energy dips and cravings after meals
Sleepiness, brain fog, or cravings after a high-carbohydrate meal can have many causes. In some people, it may reflect larger glucose and insulin swings after eating.
A pattern matters more than one meal. If fatigue reliably follows sweet drinks, refined grains, or large starch portions, it may be worth discussing blood sugar control and insulin-related testing.
3. Higher triglycerides or lower HDL cholesterol
A lipid panel can show metabolic strain before glucose is clearly abnormal. Higher fasting triglycerides and lower HDL cholesterol often appear in insulin-resistant patterns and metabolic syndrome.[4]
These markers are not specific to insulin resistance. Alcohol intake, thyroid function, genetics, medications, liver health, and diet pattern can also affect them.
4. Blood pressure creeping upward
Insulin resistance often travels with elevated blood pressure. Even high-normal readings may matter when they appear alongside waist changes, triglycerides, low HDL cholesterol, or borderline glucose.
Home blood pressure readings can help reduce the noise of one stressful clinic visit. Persistent elevation should be reviewed with a healthcare professional.
5. Skin changes such as acanthosis nigricans
Acanthosis nigricans can appear as darker, thicker, velvety skin in folds such as the neck, underarms, or groin. It is commonly associated with diabetes and insulin resistance, though other causes are possible.[5]
Skin tags are common and often harmless. When they cluster with waist gain, lipid changes, or family history, they can be another reason to look at the broader metabolic picture.
6. PCOS-related features
For people with ovaries, irregular cycles, acne, unwanted facial hair growth, or a PCOS diagnosis can signal higher insulin resistance risk. PCOS-related glucose intolerance may be missed if only fasting glucose is checked.[6]
A focused guide to PCOS insulin resistance may be useful when cravings, weight changes, cycle symptoms, and glucose concerns overlap.
Most guides skip this, but it matters: early insulin resistance is not always visible in body size. A person can have a “normal” BMI and still show high triglycerides, fatty liver markers, post-meal glucose spikes, or strong family-history risk.
That matters because weight-only screening can delay useful care. A better approach is to look at waist, blood pressure, lipids, glucose trends, liver markers, sleep, activity, and family history together.
Which tests help confirm risk?
No single routine lab perfectly confirms early insulin resistance in everyday care. The most accurate research methods, such as the hyperinsulinemic-euglycemic clamp, are complex and not used for routine screening.[7]
Clinicians usually combine glucose tests, insulin-related markers, lipid results, blood pressure, waist measurements, medical history, and sometimes liver markers. The goal is risk clarity, not reducing a person to one number.
| Test or marker | What it can show | Main limitation |
|---|---|---|
| Fasting plasma glucose | Blood glucose after an overnight fast. | May look normal in early insulin resistance. |
| A1C | Estimated average glucose over roughly 2–3 months. | Can miss some cases or be affected by blood and kidney conditions. |
| 2-hour OGTT | Glucose response after a 75-gram glucose drink. | Less convenient and takes more time. |
| Fasting insulin | How much insulin is present during fasting. | Reference ranges and interpretation vary by lab. |
| HOMA-IR | A calculated estimate using fasting glucose and fasting insulin. | Cutoffs are not universally standardized.[8] |
| Lipid panel | Triglycerides, HDL, LDL, and total cholesterol patterns. | Affected by diet, genetics, thyroid function, liver health, and medications. |
Fasting glucose and A1C: useful, but incomplete
Fasting plasma glucose and A1C are widely used because they are accessible and standardized. They help identify prediabetes and diabetes risk using established thresholds.[1]
For early insulin resistance, they can be late markers. A person may need more insulin for months or years before glucose rises above the usual cutoff.
Oral glucose tolerance test: often more revealing
The 2-hour OGTT measures fasting glucose and then glucose again after a glucose drink. It can reveal impaired glucose tolerance that fasting glucose may miss.
This can be especially relevant with PCOS, prior gestational diabetes, strong family history, rising A1C, or post-meal symptoms despite normal fasting labs.[6]
If your results seem inconsistent, the guide to prediabetes with normal fasting glucose explains why A1C, fasting glucose, and OGTT can disagree.
Fasting insulin and HOMA-IR: context, not a yes-or-no answer
Fasting insulin may suggest compensation when glucose is still normal. HOMA-IR can support a broader assessment when interpreted with fasting glucose, lipids, waist, and clinical context.
Because insulin assays and HOMA-IR cutoffs vary, these results should not be treated as a universal diagnosis. They are best used as part of a clinician-guided pattern review.[8]
What do common blood sugar test results mean?
These categories are widely used in diabetes and prediabetes screening. A clinician may interpret them differently in pregnancy, illness, anemia, kidney disease, or medication-related contexts.
| Test | Typical normal range | Prediabetes range | Diabetes range |
|---|---|---|---|
| A1C | Below 5.7% | 5.7%–6.4% | 6.5% or higher |
| Fasting plasma glucose | Below 100 mg/dL | 100–125 mg/dL | 126 mg/dL or higher |
| 2-hour OGTT | Below 140 mg/dL | 140–199 mg/dL | 200 mg/dL or higher |
In the absence of clear high-glucose symptoms or crisis, diabetes diagnosis generally requires confirmatory testing. A clinician may repeat the same test or use a different diagnostic test promptly.[1]
Borderline results deserve context. Recent illness, sleep loss, stress, anemia, pregnancy, kidney disease, medications, and lab variability can influence results.
When should you talk to a clinician?
When to see a clinician: Make an appointment if waist circumference, blood pressure, triglycerides, A1C, fasting glucose, liver enzymes, or post-meal symptoms are trending in the wrong direction. Seek urgent care for severe thirst, frequent urination, vomiting, confusion, unexplained rapid weight loss, or very high glucose readings if you monitor at home.
A helpful next step is to bring patterns, not a long diary. Try statements such as “I get sleepy after lunch most days” or “my triglycerides rose across two lab panels.”
For people with prediabetes, structured lifestyle programs have strong evidence for reducing progression to type 2 diabetes risk. In the Diabetes Prevention Program, intensive lifestyle intervention reduced diabetes incidence more than placebo, with metformin also showing benefit.[9]
That does not mean everyone needs the same plan. It supports the value of food quality, movement, sleep, weight management when appropriate, and consistent follow-up.
What progress can you track?
Early insulin resistance often improves through repeated signals, not one dramatic change. Many people notice steadier energy first, while lab changes may take longer.
Useful near-term markers include post-meal sleepiness, cravings, walking consistency, protein and fiber intake, sleep regularity, and waist measurement. These markers are not diagnostic, but they can show whether daily habits are becoming more supportive.
Lab markers often need more time. Triglycerides, fasting glucose, A1C, fasting insulin, and blood pressure may require 8–12 weeks or longer to show a reliable trend.
A sustainable plan matters more than intensity. A repeatable plan during busy weeks is more useful than a perfect plan that collapses after four days.
A simple 4-week insulin sensitivity plan
This plan is educational and general. Anyone with diabetes, pregnancy, a history of eating disorder, glucose-lowering medication, or significant medical conditions should personalize changes with a qualified professional.
Week 1: Build steadier meals
Start two meals around protein, high-fiber carbohydrates, healthy fats, and non-starchy vegetables. This structure may reduce large glucose swings compared with meals built mostly from refined starch or sugar.
Examples include Greek yogurt with berries and nuts, tofu with vegetables and beans, or a lentil bowl with greens, olive oil, and lean protein.
Week 2: Add post-meal movement
Add 10–15 minutes of easy walking after one main meal most days. Systematic review evidence suggests walking soon after meals can reduce postprandial glucose excursions.[10]
The goal is not punishment or calorie burning. It is giving muscle tissue a chance to use incoming glucose.

Week 3: Anchor sleep
Choose a consistent wake time and reduce late-night eating when possible. Sleep loss can make appetite, cravings, stress hormones, and glucose regulation harder to manage.
A simple evening routine may help: dim lights, prepare tomorrow’s breakfast, keep caffeine earlier, and protect the final hour before bed.
Week 4: Review and decide what to test
Look for patterns rather than perfection. Are afternoon crashes less intense? Are cravings easier to manage? Is walking after meals becoming automatic?
If risk factors remain present, consider asking about A1C, fasting glucose, fasting insulin, lipids, liver enzymes, blood pressure, waist circumference, and possibly OGTT.
For a broader prevention pathway, this guide on how to lower diabetes risk can help turn early feedback into a realistic next step.
Frequently Asked Questions
What are the most important signs of early insulin resistance?
The most important signs of early insulin resistance are usually patterns, not one symptom. Increasing waist circumference, high triglycerides, low HDL cholesterol, elevated blood pressure, acanthosis nigricans, fatty liver markers, PCOS-related features, and strong post-meal sleepiness may all matter. Normal fasting glucose does not always rule it out.
Can you have insulin resistance with a normal A1C?
Yes, insulin resistance can be present while A1C remains normal. Early on, the pancreas may produce more insulin to keep glucose controlled. That compensation can make glucose-based tests look reassuring for a while. Other markers such as waist, triglycerides, fasting insulin, and OGTT results may add context.
Is fasting insulin a good test for insulin resistance?
Fasting insulin can be helpful, but it is not a perfect stand-alone test. Results can vary by lab method, recent sleep, stress, food timing, and individual biology. It is usually most useful when paired with fasting glucose, lipids, waist measurement, blood pressure, and medical history.
Which test is better: A1C or oral glucose tolerance test?
Neither test is always better; they answer different questions. A1C reflects average glucose over roughly 2–3 months and is convenient. An oral glucose tolerance test shows how glucose responds to a glucose challenge and may catch impaired glucose tolerance that fasting tests miss.
How often should borderline glucose or insulin markers be rechecked?
The right timing depends on the result, risk factors, symptoms, medications, and pregnancy status. Many clinicians recheck borderline glucose markers within several months, while stable lower-risk results may be followed less often. Ask for a follow-up plan that includes which marker will be repeated and what change would trigger action.
Conclusion
Early insulin resistance is not always loud, obvious, or visible from body size alone. It often appears as a cluster of small signals before fasting glucose or A1C clearly crosses a threshold.
The most useful response is not panic. It is pattern recognition, appropriate testing, and a repeatable plan for meals, movement, sleep, and follow-up.
Medical Disclaimer: The information provided in this article is for educational purposes only and does not constitute medical advice. Always consult a qualified healthcare provider before making changes to your diet, lifestyle, or treatment plan. TheMetabolicHub.com does not replace professional medical guidance.
References
- American Diabetes Association Professional Practice Committee. “2. Diagnosis and Classification of Diabetes: Standards of Care in Diabetes—2026.” Diabetes Care. 2026;49(Suppl 1):S27-S49. Source
- National Institute of Diabetes and Digestive and Kidney Diseases. “Insulin Resistance & Prediabetes.” Source
- Freeman AM, Acevedo LA, Pennings N. “Insulin Resistance.” StatPearls. NCBI Bookshelf. Source
- Swarup S, Goyal A, Grigorova Y, Zeltser R. “Metabolic Syndrome.” StatPearls. NCBI Bookshelf. Source
- Hughes EK, Brady MF. “Acanthosis Nigricans.” StatPearls. NCBI Bookshelf. Source
- Teede HJ, Tay CT, Laven JJE, et al. “Recommendations From the 2023 International Evidence-based Guideline for the Assessment and Management of Polycystic Ovary Syndrome.” Journal of Clinical Endocrinology & Metabolism. 2023;108(10):2447-2469. Source
- Madan R, DeFronzo RA. “Assessing Insulin Sensitivity and Resistance in Humans.” Endotext. NCBI Bookshelf. Source
- Gayoso-Diz P, Otero-González A, Rodriguez-Alvarez MX, et al. “Insulin Resistance (HOMA-IR) Cut-Off Values and the Metabolic Syndrome in a General Adult Population.” BMC Endocrine Disorders. 2013;13:47. PMID: 24131857
- Knowler WC, Barrett-Connor E, Fowler SE, et al. “Reduction in the Incidence of Type 2 Diabetes with Lifestyle Intervention or Metformin.” New England Journal of Medicine. 2002;346(6):393-403. PMID: 11832527
- Engeroff T, Groneberg DA, Wilke J. “After Dinner Rest a While, After Supper Walk a Mile? A Systematic Review with Meta-analysis on the Acute Postprandial Glycemic Response to Exercise Before and After Meal Ingestion.” Sports Medicine. 2023;53(4):849-869. PMID: 36715875